Introduction
BUILDSPACE
This project is a product of the program BUILDSPACE Horizon 2020.
The BUILDSPACE project aims to develop innovative applications to support buildings' energy efficiency and cities' resilience and sustainability.
The project will utilize cutting-edge technologies, such as satellite data analysis, digital twins, virtual and augmented reality (AR/VR), and drones equipped with thermal cameras. The BUILDSPACE project will provide services to enable users to interact with a building's digital twin and the city's stakeholders to effectively monitor the energy performance of the city's buildings to develop strategies for the sustainability and resilience of cities against the risks posed by climate change, with an emphasis on the analysis of the urban thermal environment and flooding.
BUILDSPACE's services will be implemented in four European Union countries, Greece, Latvia, Slovenia, and Poland. The project, which will last three years, is financed with €3 million by the EUSPA European Program. More information is available here: Home | BUILDSPACE
National Technical University Athens, EPU of the Decision Support Systems Laboratory School of Electrical and Computer Engineering, is one of the main partners for the implementation of the BUILDSPACE project. More information about EPU can be found here: Home | EPU-NTUA
Through the utilization of Geographical Information Systems (GIS), EPU’s team was able to contribute to Service 3 of the BUILDSPACE project by creating a Solar Map of the municipality of Riga, Latvia. Service 3, relies on a mix of Copernicus and Internet of Things (IoT) data to infer visualizations related to energy demand, and assessment of energy building blocks at city scale, facilitating decision making for increased resilience of building stock The aim of the Solar Map is to be used as a decision supporting tool for both policy makers and citizens alike, by offering insight into the installation and utilization of Photovoltaic (PV) technology.
Riga Solar Map
Latvian pilot at the city of Riga involving the regional authority (RPR) focuses on the testing of the building energy demand forecast service at city scale. On that regard, the Solar Map of Riga, represents an estimation of the PV potential on a city scale. The aim was to create a friendly map interface of the city, where the user will be able to find a building block of interest through a search bar or by clicking and instantly receive information regarding the estimated available space for installation, the annual PV electricity production potential of the rooftop, electricity savings, CO2 reduction estimation and Payback Period of the investment.
How to use this map
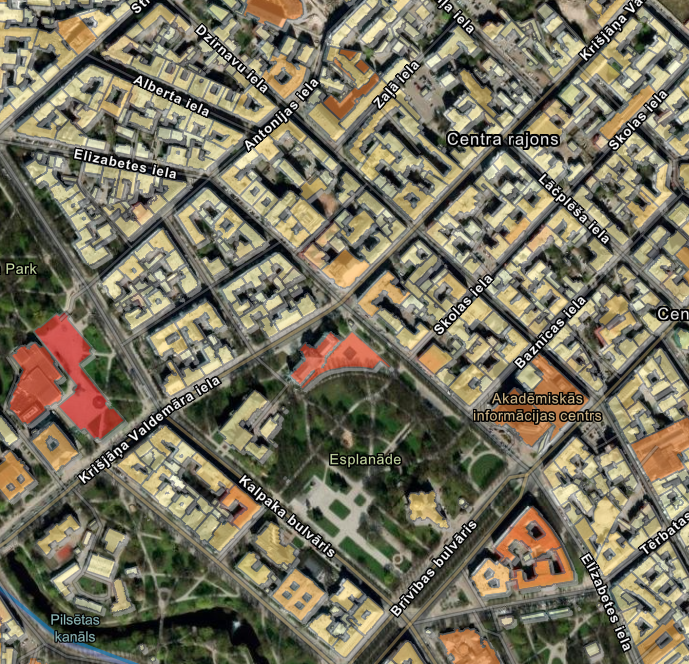
The solar map presents a cadastral group of the municipality of Riga.
Explore the Map
- Use the left mouse button to explore the map and click on any location of interest, such as rooftops, represented by different colors.
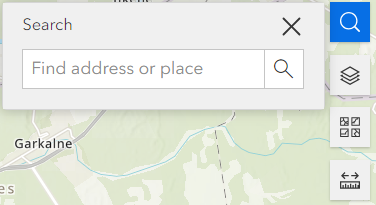
- Find address or place option:
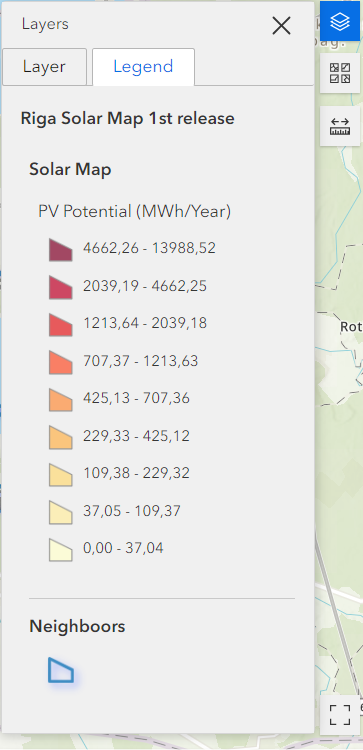
Legend Option
- Open the Legend option to explore the different feature layers of the map, as well as, the information of each layer:
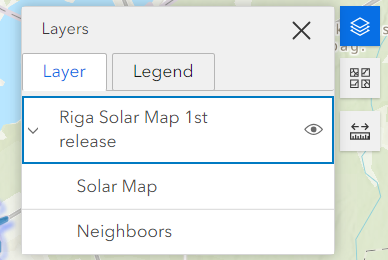
Layer Interface
- Use the Layer interface to make invisible or visible each available layer:
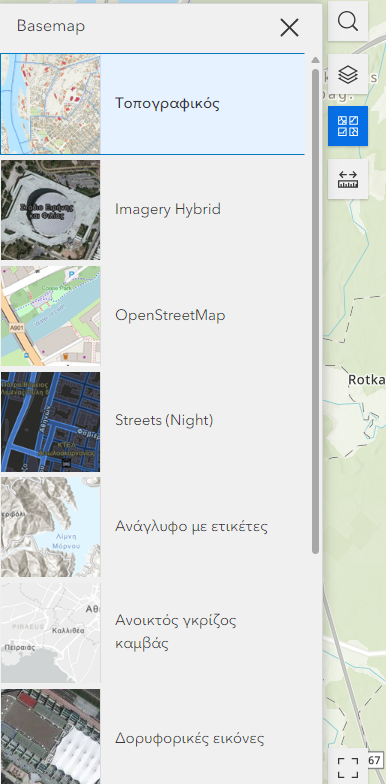
Customize Basemap
- Use the basemap option to choose between a variety of basemaps available by ESRI:
Zoom in the map to explore the available rooftops in greater detail. By clicking on a rooftop, the user may explore information regarding the chosen building and different PV related information such as the sum of available PV Panels, max kWp potential installation, and PV electricity potential production in MWh/Year.
In future updates, the user will be able to acquire information regarding the self-consumption of PV electricity produced, the Payback period of PV installation, and CO2 Mt averted due to the PV installation and use.
Disclaimer
This project was created as the final technological release deliverable for Horizon Europe European Commission project BUILDSPACE.
Creator : Iason C. Dimitriou, DSS Lab, NTUA.
Contributor : Dr. Apostolis Arsenopoulos, DSS Lab, NTUA.
Licensed under: License Creator's Report-Non-Commercial Use-No Derivative Works (CC BY-NC-ND).